
AB Testing Summary
Table of Contents
The A/B testing is a randomized test that compares two different things (i.e., A and B) hypothetically. The test utilizes statistical hypothesis testing. An A/B testing can be used to test the difference between two different versions of a variable, usually by having A and B differ only in the target variable in an experiment, and then testing the difference between the responses of the two groups in the results as to which is better.
- Arises in the field of agriculture: which way is better for a certain crop.
- In medicine: whether a new drug is effective.
- In law: the presumption of innocence.
- In politics: Obama’s presidential campaign, gaining online traction by using A/B tests to find out what voters want to see from presidential candidates.
- Web online data testing: which algorithms, designs, and features users prefer.
Questions #
Which of the following scenarios are applicable for A/B test?
- Test whether the products in our marketplace are rich enough.
- Test whether value-added services should be launched.
- Test the effect of the new recommendation sorting algorithm.
- Test the impact on users of changes in page loading speed and display results due to changes in infrastructure.
- Test whether an optimization can increase the repurchase rate of users for a paid product.
- Test the impact of changing the main logo of the product on users.
- Examine the impact of latency on the homepage.
Answers will be provided in the end.
Procedure #
- Setting experimental objectives and establishing hypotheses;
- Determine the distribution model, parameters (statistics, significance, statistical power, sample size);
- Determining the experimental protocol: experimental group & control group; flow distribution model;
- A/A & A/B testing;
- Evaluation of experimental effects: judgment of experimental validity; comparison of experimental results;
Statistical Theory #
Probability Distribution #
- Bernoulli distribution: whether a given user clicks on a button when browsing a web page.
- Binomial distribution: the distribution of the number of n users who click on a button when browsing a web page.
- Poisson distribution: (small probability event) the distribution of the number of users clicking a button within 1 second. (Many applications: number of car accidents at an intersection per unit of time, number of mutations in DNA, number of radioactive nuclei decaying ……)
- Normal distribution:The distribution of the number of people who click on a button when a large number of users are browsing a web page.
 |  |  |
| Binomial Distribution | Poisson Distribution | Normal Distribution |
Hypothesis Testing #
Hypothesis testing is a method of statistical inference, in which hypotheses are tested by modeling the observation of random variables to obtain estimates of unknown parameters.
- Lady Tasting Tea Case A female colleague of Fisher, a statistician, claimed to be able to tell whether tea or milk was added first to a milk tea. Fisher decides to determine whether the lady’s claim is true or false through a scientific experiment. He was faced with these questions:
- how many cups of tea (sample size) should be served to the lady?
- In what order should these teas be served (randomness)?
- how much information should the lady be told about the order in which the cups of tea should be served (a priori knowledge)? …… Eventually Fisher proposes to give her 8 cups of milk tea. The lady knows that 4 of the cups will be served with tea first and 4 with milk first, but in a randomized order, the lady has to choose the 4 cups that are “milk first and tea second”.
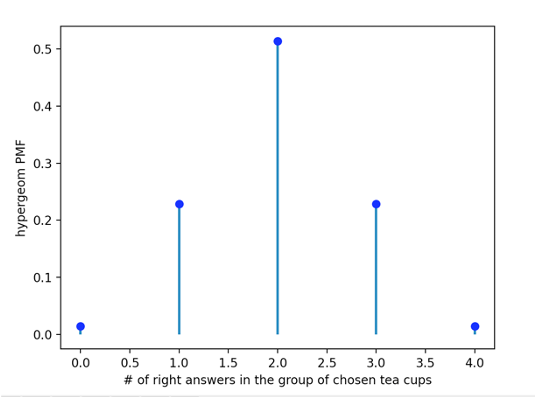
The test statistic is the number of confirmations that are correct. The null hypothesis H0 is that the lady is unable to determine whether tea or milk is added first to the milk tea. The alternative hypothesis H1 is that the lady is incapable of doing so. The distribution of the tea tasting experiment for ladies is a hypergeometric distribution. So how many cups does the lady answer correctly before we can reject the null hypothesis, which is to prove that the lady has the ability to judge milk tea?
- How to avoid misjudging the results of an experiment? As an experiment, it is possible to get wrong feedback results. But we can control the probability of error based on the distribution.
| Decision | H0 is True | H0 is False |
|---|---|---|
| Reject H0 | Type I error (probability α) | H0 is False |
| Accept H0 | Right | Type II error (probability α) |
In the case of the “lady tasting tea”, the Type I error is that the lady actually has the ability to discriminate, while the experiment results judge that she cannot, and Type II is the opposite. The test for Type I errors is called a significance test. (The significance level is (1- α). In a typical experiment, α is set at 5% and β at 20%. It represents the psychology of “it is better to miss four than to let one go” - in product feature experiments, it represents that people would rather miss 4 good features than to let 1 bad feature go online.
- How many cups can a lady answer correctly to reject the original hypothesis?
As shown in the following probability histogram, the probability of a lady getting 3 cups right in a randomized situation is 2.29%, and the probability of getting 4 cups right is 1.43%. Therefore, as long as the lady chooses more than 2 cups correctly, it can be assumed with 95% confidence that the lady is capable of judging the order in which milk tea is added to milk and tea.
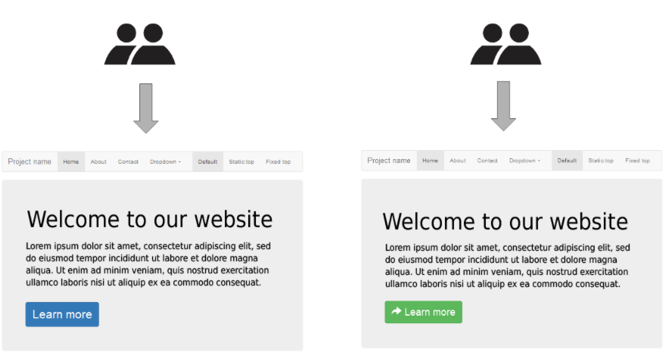
Example - AB testing for changing the color of a button #
- Setting Experiment Goals and Formulating Hypotheses**
The original button color is blue, and we want to investigate how changing the button color to green affects user click-through rates.
Null Hypothesis (H0): Changing the button color from blue to green has no effect on user click-through rates. Alternative Hypothesis (H1): Changing the button color to green, as compared to blue, positively impacts user click-through rates.
- Determining the Model
Whether each user clicks the button while browsing the webpage follows a Bernoulli distribution. The question of whether a certain number of users click while browsing the webpage follows a Binomial distribution.
Due to the substantial daily active users (DAU) on the webpage, the distribution of users clicking the button when browsing the webpage follows a Normal distribution.
Therefore, we will use an independent two-sample proportion test. In cases with large samples, the sampling distribution of the difference between p1 and p2 is approximately normal. Hence, we can choose the z-value as the test statistic.
- Sample Size & Parameter Assessment
When the button is blue, the average daily click-through rate for users is 2%. Now, the desired increase in click-through rate with the color change to green is 20%, aiming for 2.4%.
With a significance level (α) of 5% and statistical power (1-β) at 80%, how many samples are needed?
Answer: 19,784
You can perform the calculation online using this tool: Sample Size Calculator
- Determining the Experimental Plan: Experimental Group & Control Group; Traffic Allocation Model
Considering the current DAU on the webpage is 50,000, and we need to reach 19,784 for the experiment. We also want to ensure that the experiment doesn’t disrupt the majority of current users’ experience.
Therefore, we will randomly assign 90% of the users as the control group (Group A) and 10% of the users as the experimental group (Group B) daily.
Calculations indicate that the required sample size can be achieved in just 4 days.
Experimental Plan:
- Group A: Randomly select 90% of daily active users.
- Group B: Randomly select 10% of daily active users.
- Duration of Experiment: 4 days.
- Expected Sample Size: 20,000 users.
| Group A | Group B |
|---|---|
| **Experimental group:** 90% of daily active users | **Control group:** 10% of daily active users |
- Quantities Summary Assuming
\(\text{H0: }\bar{x_1} = \bar{x_2}\)
\(\text{H1: }\bar{x_1} > \bar{x_2}\)
\(\text{Test Statistic z: }\frac{\bar{x1}-\bar{x2}-\mu_0}{{s_1}^2/n1+{s_2}^2/n_2}\).
Sample Size for Group A (n1): 178,056 Sample Size for Group B (n2): 19,784 Standard deviation (s) and mean (x) are calculated from actual data.
Parameters: Significance Level: 5% Statistical Power: 80%
- Evaluation of Experimental Results
- Whether there is a change in click-through rate at a significance level of 95%.
- Assessment of the effective sample size and identification of outliers.
- Detailed segmentation: Analyze which user profiles or user segments experience a more significant increase in clicks and which experience less.
- Consideration of other relevant metrics: Variance, subsequent user behavior, etc.
Pitfalls #
- Experimental Design
- Disregard confidence levels.
- Significance in A/B/n testing.
- One or multiple metrics.
- Statistical power consists of two components: sample size and the magnitude of the expected conversion rate.
- During the Experiment
- Avoid peeking at the experiment: Checking results multiple times can increase errors.
- Avoid ending the experiment prematurely: the novelty effect and the “regression to the mean” phenomenon.
- Changing traffic allocation: if changes are necessary, the experiment should be restarted.
- Statistical Testing
- Assess the impact on other metrics: Click-through rate and conversion rate.
- User segmentation: However, be cautious as segmentation can increase errors.
- Inference from results: Short-term and long-term effects, causation and correlation, interval estimation.
Answers #
Which of the following scenarios are applicable for A/B test?
- Test whether the products in our marketplace are rich enough. (❌ Not suitable. Even if a product is tested upon launch, it cannot determine if users are missing other products. Suggested approach: User surveys.)
- Test whether value-added services should be launched. (❌ Not suitable. Users need to actively choose value-added services, so randomly assigning users for testing is not reasonable, as there is no control group. Suggested approach: Assess user interest in value-added services—percentage of users opting for them.)
- Test the effect of the new recommendation sorting algorithm. (✅ Suitable. Comparing the new and old algorithms can be done using user click-through rates. Amazon tested personalized product recommendations and found an increase in sales.)
- Test the impact on users of changes in page loading speed and display results due to changes in infrastructure. (✅ Suitable. If computational resources are sufficient, both can run simultaneously.)
- Test whether an optimization can increase the repurchase rate of users for a paid product. (❌ Not suitable. The duration is too long, spanning a year, resulting in limited data.)
- Test the impact of changing the main logo of the product on users. (❌ Not suitable. Changing a company’s logo can emotionally affect users, and they may need time to adapt to the new logo. Short-term AB data is insufficient.)
- Examine the impact of latency on the homepage. (✅ Suitable. Both Google and Amazon have demonstrated the effects of a 100-millisecond delay on users and sales through A/B testing.)
References #
- http://elem.com/~btilly/ab-testing-multiple-looks/part1-rigorous.html
- “How 20th Century Statistics Revolutionized Science: Lady Tasting Tea” by Salsburg (《20世纪统计怎样变革了科学:女士品茶》—— 萨尔斯伯格)
- Udacity - AB Test (Udacity-AB 测试)
- “Probability Theory and Mathematical Statistics” by Chen Xiru (《概率论与数理统计》—— 陈希孺)
- https://cxl.com/blog/testing-statistics-mistakes/